The MMTG Indicator Package unlocks your full potential as a trader or investor to make smarter, more profitable trades, by simplifying complex technical analysis in an easy to understand way with clear visual trade signals.
Buy/Sell Indicator
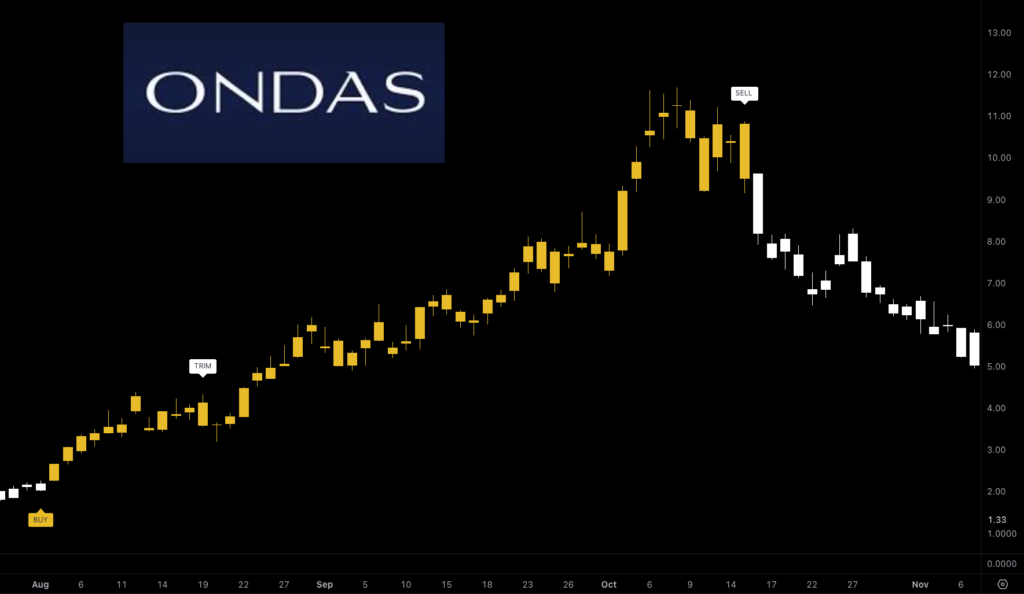
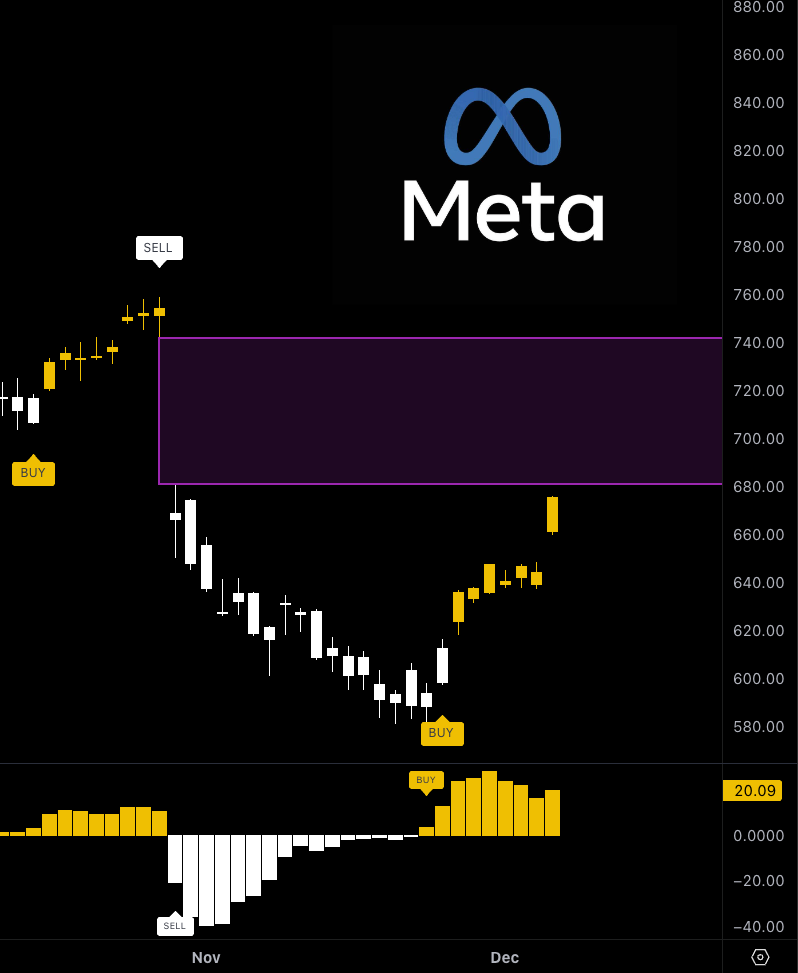
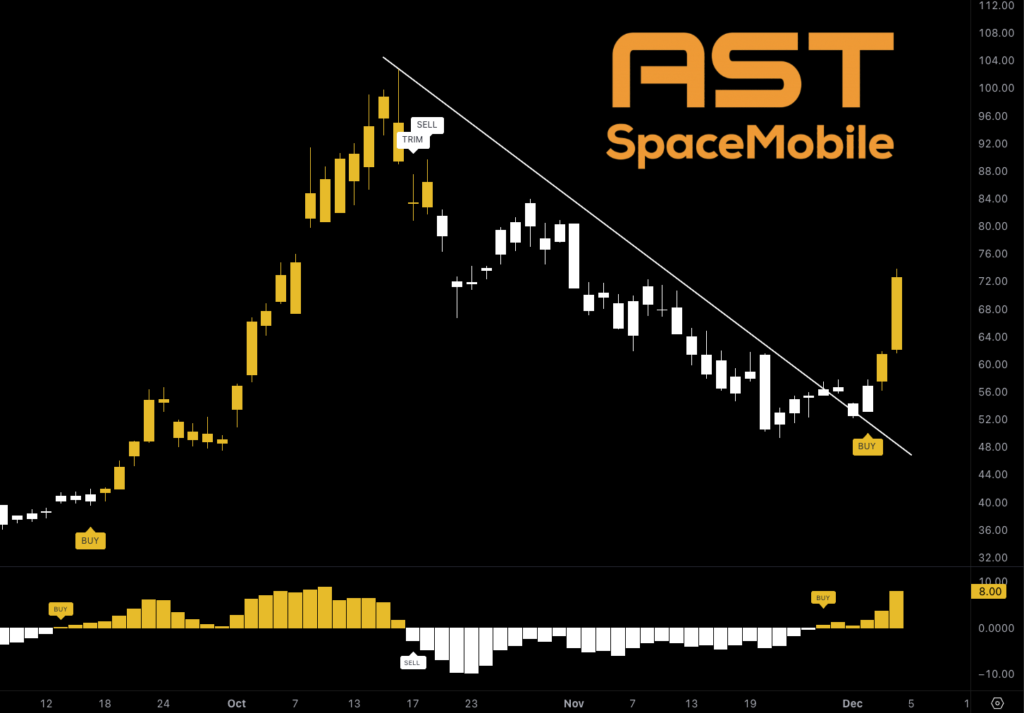
The Buy/Sell Indicator analyses a number of key data points such as historical trends, current volume, current price action and more. It then uses state of the art technology to generate 'Buy', 'Trim' (Take some profits/sell some) and 'Sell' Labels.
This indicator simplifies technical analysis in a clear & easy to understand way with clear visual representations on when might be a good time to buy, trim, hold and/or sell.
Buy/Sell Indicator
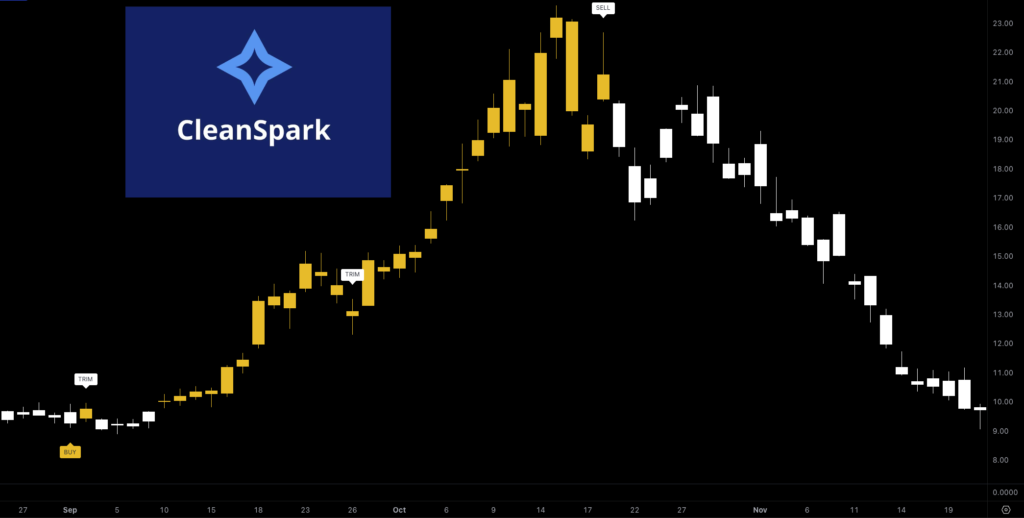
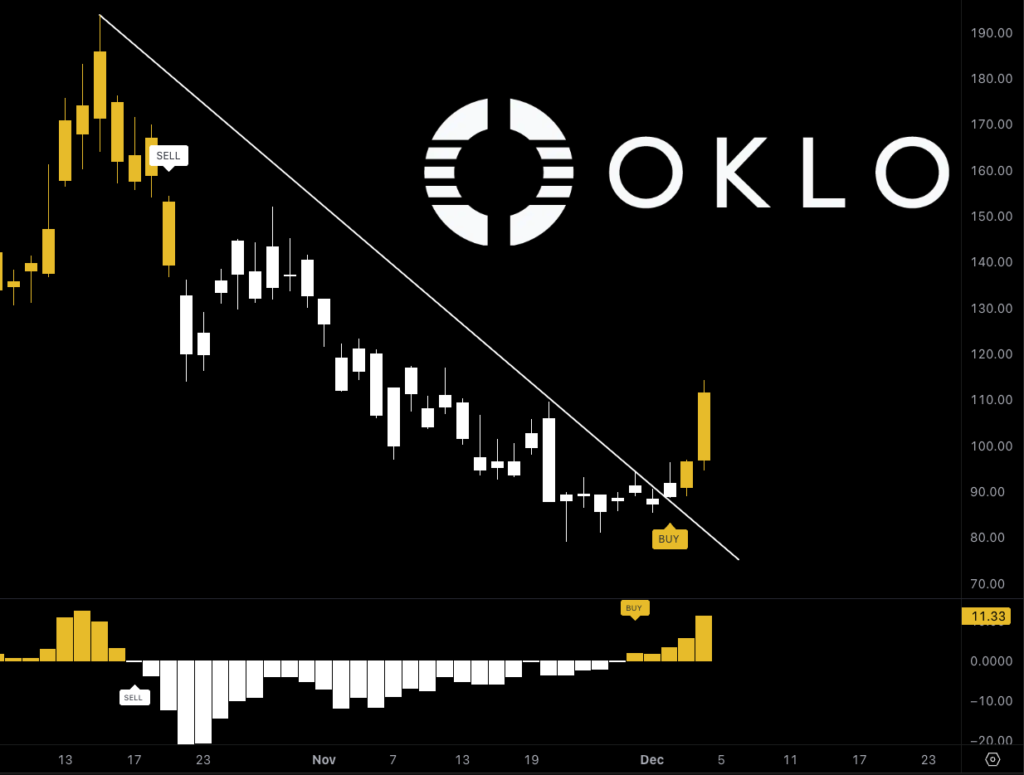
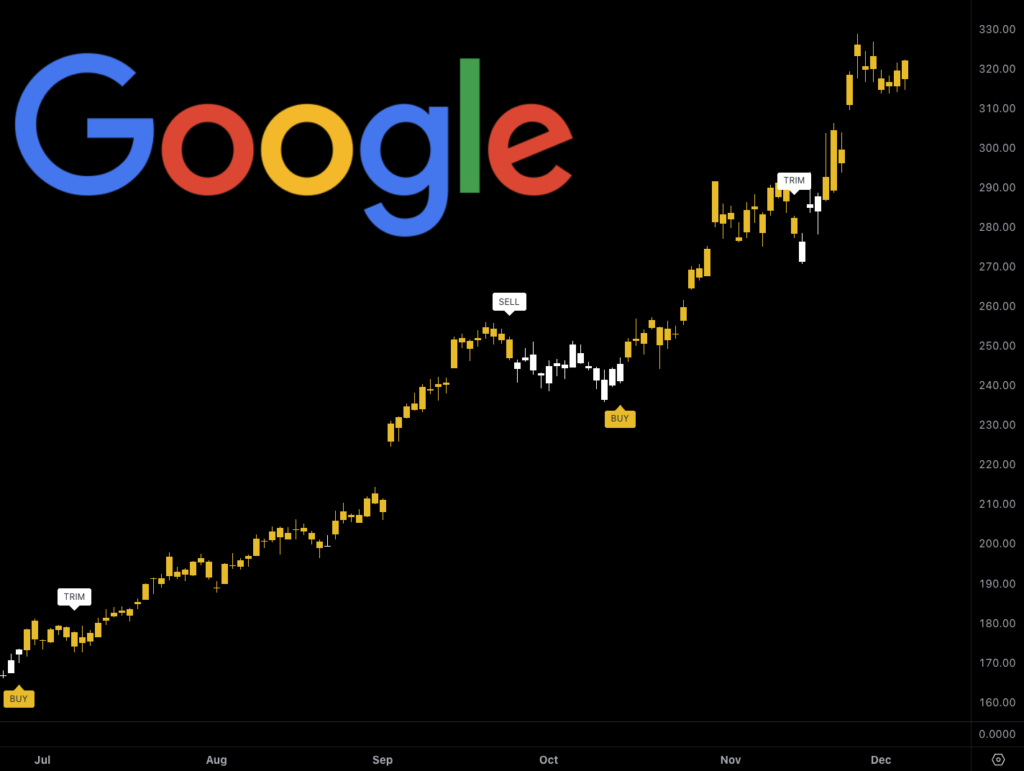
The Buy/Sell Indicator analyses a number of key data points such as historical trends, current volume, current price action and more. It then uses state of the art technology to generate 'Buy', 'Trim' (Take some profits/sell some) and 'Sell' Labels.
This indicator simplifies technical analysis in a clear & easy to understand way with clear visual representations on when might be a good time to buy, trim, hold and/or sell.
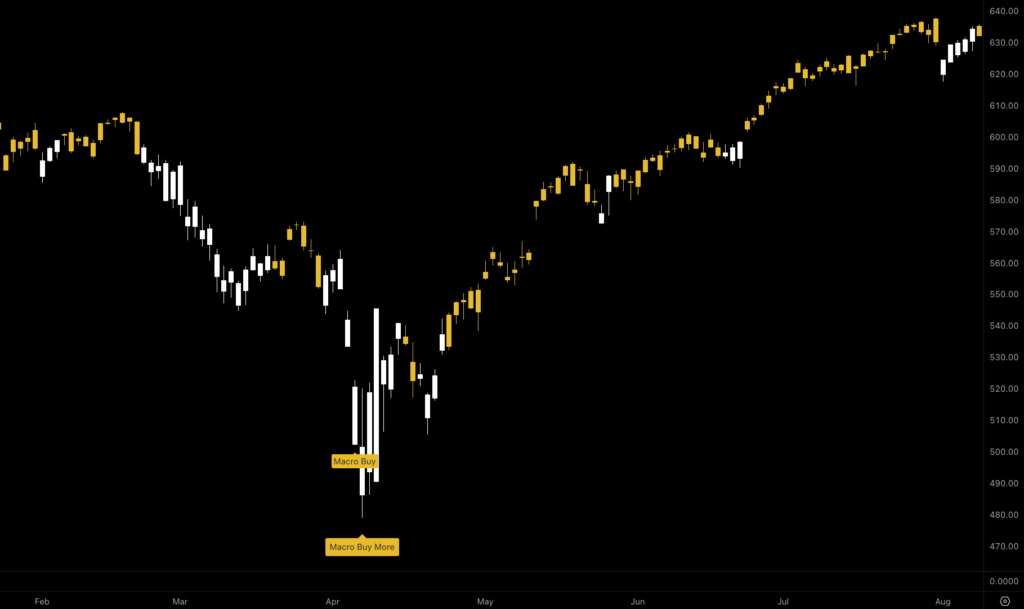
Macro Buy Indicator - April 2025
The Macro Buy Indicator identifies periods of recession/periods of severe market over-reaction, and generates 'Macro Buy', 'Macro Buy More' and 'Macro Buy Even More' signals, as we edge closer and closer to the bottom most point.
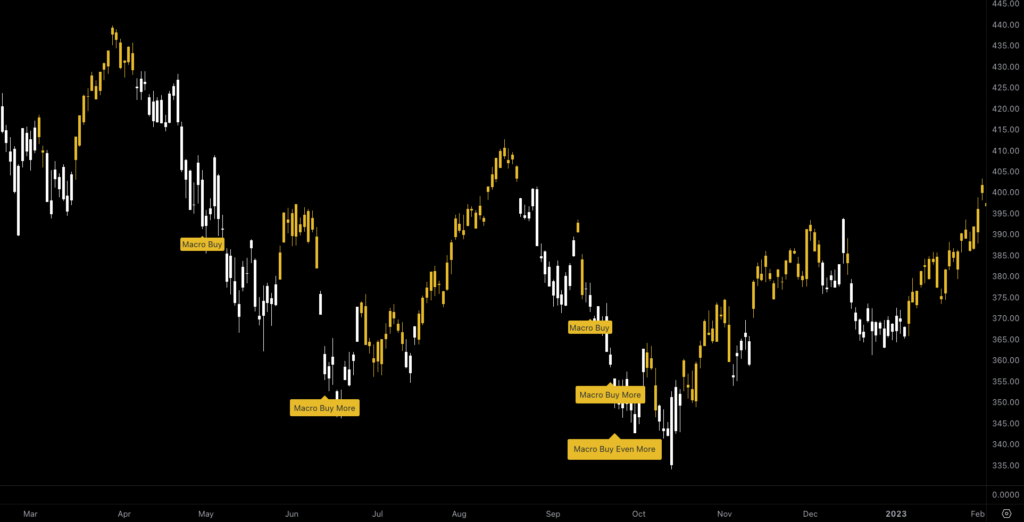
Macro Buy indicator - 2022
The Macro Buy Indicator identifies periods of recession/periods of severe market over-reaction, and generates 'Macro Buy', 'Macro Buy More' and 'Macro Buy Even More' signals, as we edge closer and closer to the bottom most point.
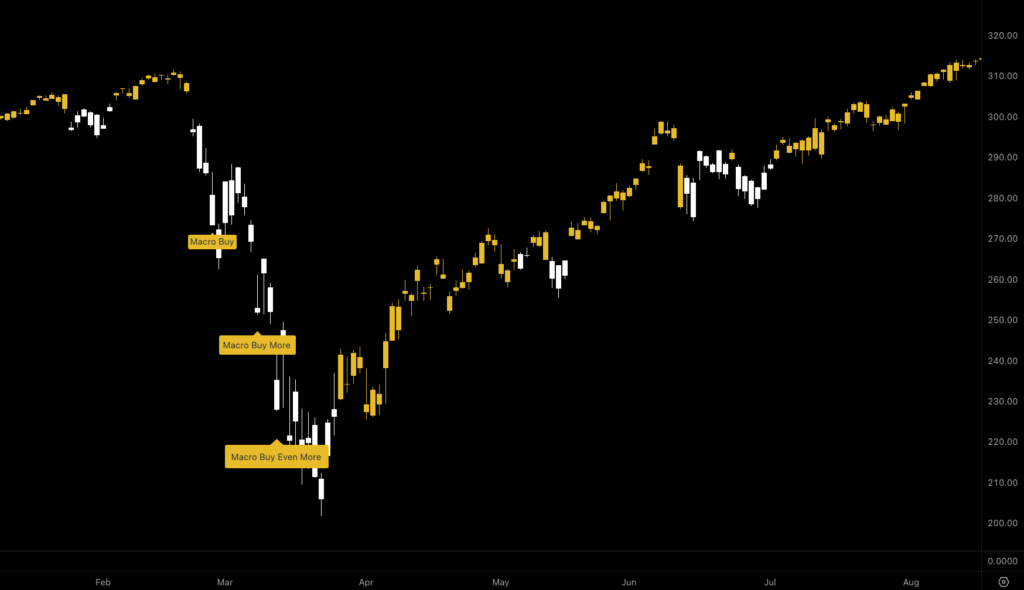
Macro Buy Indicator - 2020
The Macro Buy Indicator identifies periods of recession/periods of severe market over-reaction, and generates 'Macro Buy', 'Macro Buy More' and 'Macro Buy Even More' signals, as we edge closer and closer to the bottom most point.
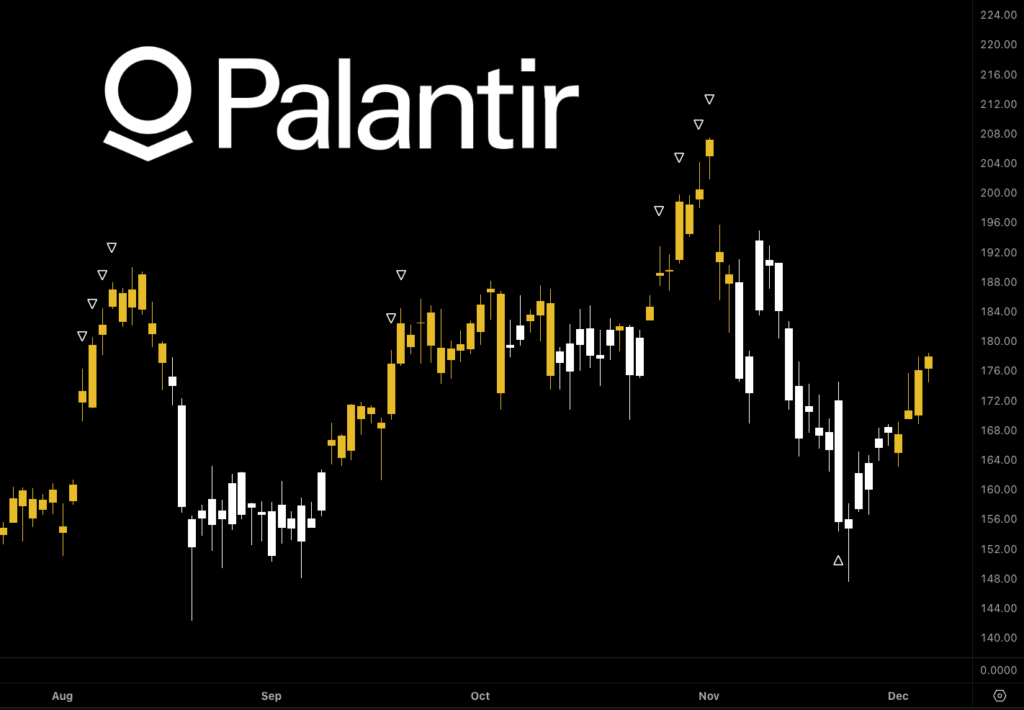
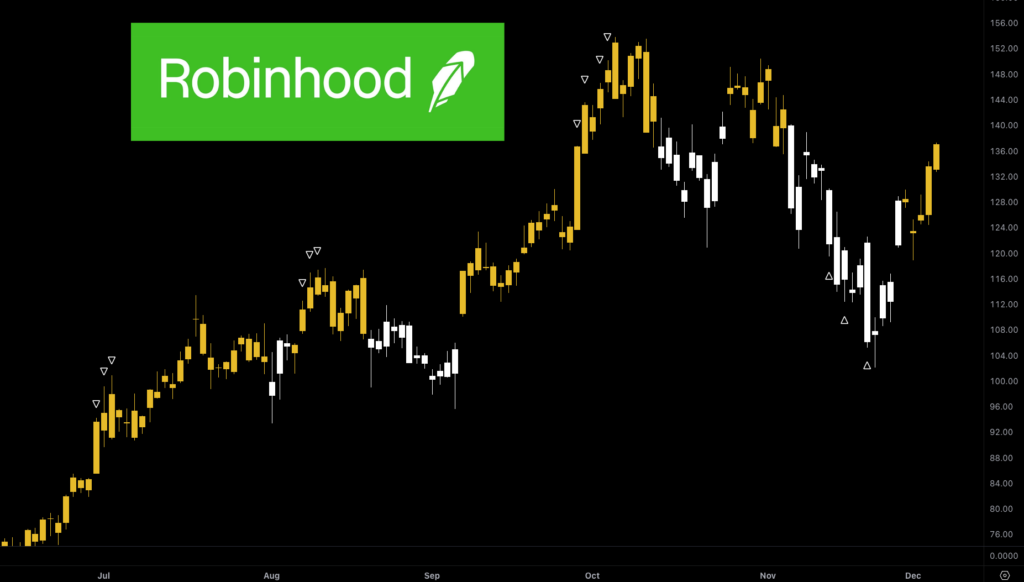
Momentum Warning
The Momentum Warning indicator helps to identify area's where the stock price is 'stretched' beyond its norms; overbought or oversold. Suggesting a period of consolidation/reversal is imminent. This can also be used as a great signal to take profits.
Momentum Warning
The Momentum Warning indicator helps to identify area's where the stock price is 'stretched' beyond its norms; overbought or oversold. Suggesting a period of consolidation/reversal is imminent. This can also be used as a great signal to take profits.
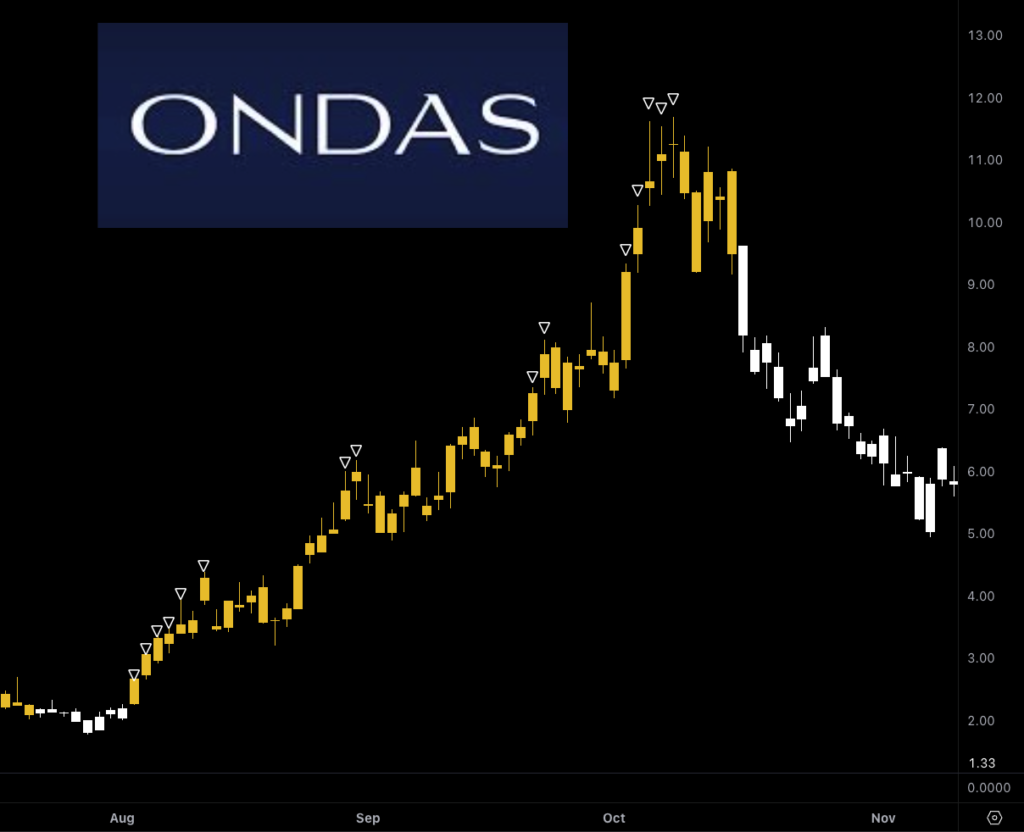
Momentum Warning
The Momentum Warning indicator helps to identify area's where the stock price is 'stretched' beyond its norms; overbought or oversold. Suggesting a period of consolidation/reversal is imminent. This can also be used as a great signal to take profits.
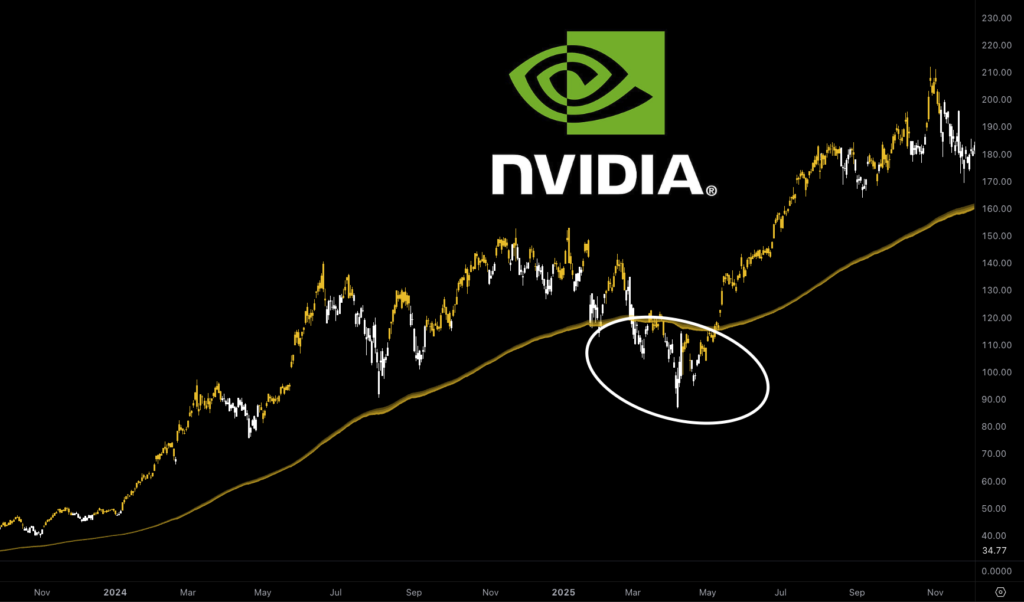
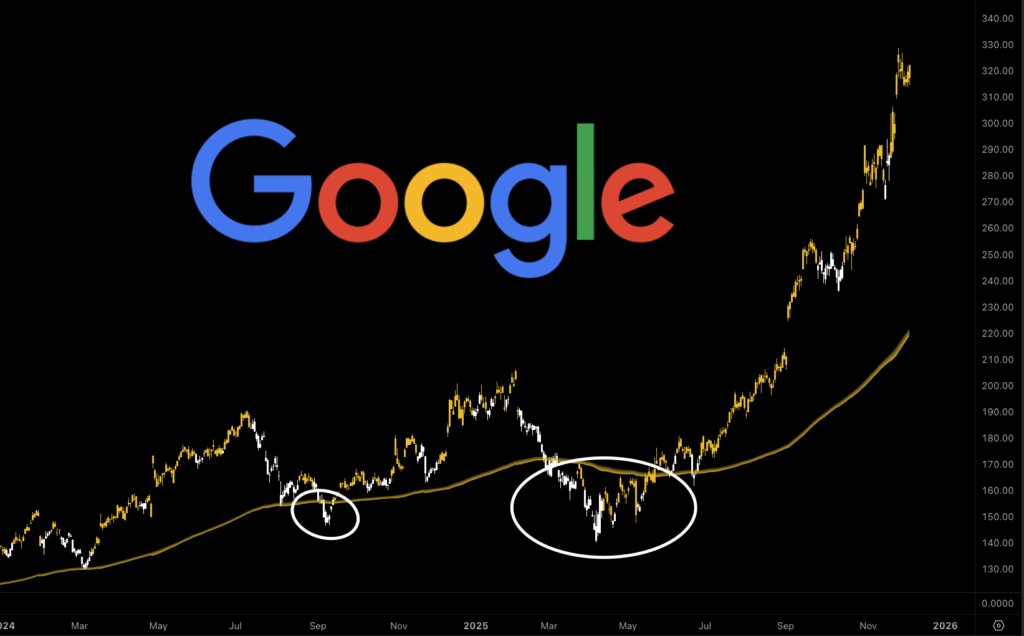
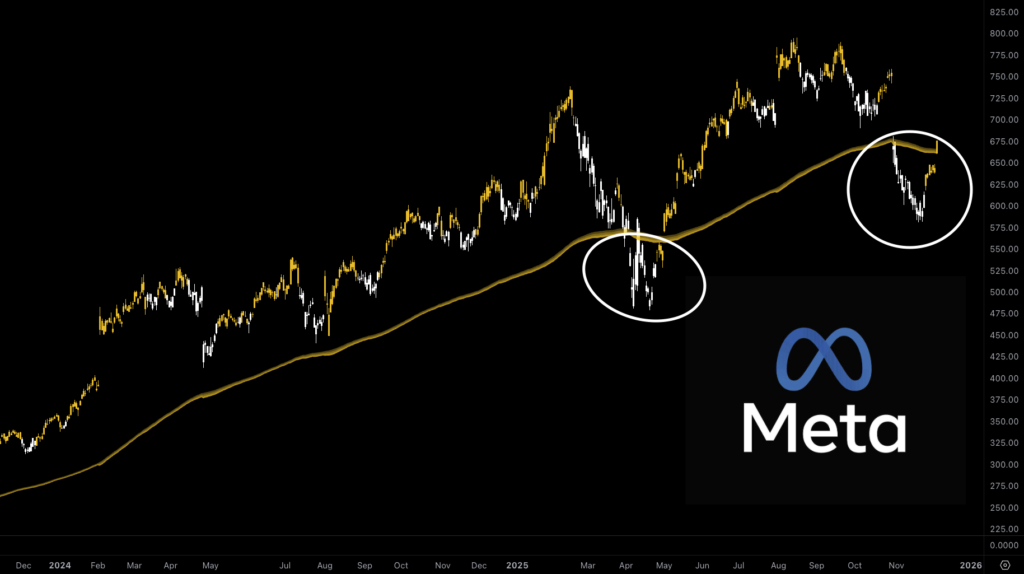
Buy Zone
The Buy Zone indicator identifies periods of extreme discount, buying a stock with strong fundamentals anywhere under the 'Buy Zone' level, and holding for 6 months+ will most likely lead to incredible results.
Buy Zone
The Buy Zone indicator identifies periods of extreme discount, buying a stock with strong fundamentals anywhere under the 'Buy Zone' level, and holding for 6 months+ will most likely lead to incredible results.
Buy Zone
The Buy Zone indicator identifies periods of extreme discount, buying a stock with strong fundamentals anywhere under the 'Buy Zone' level, and holding for 6 months+ will most likely lead to incredible results.
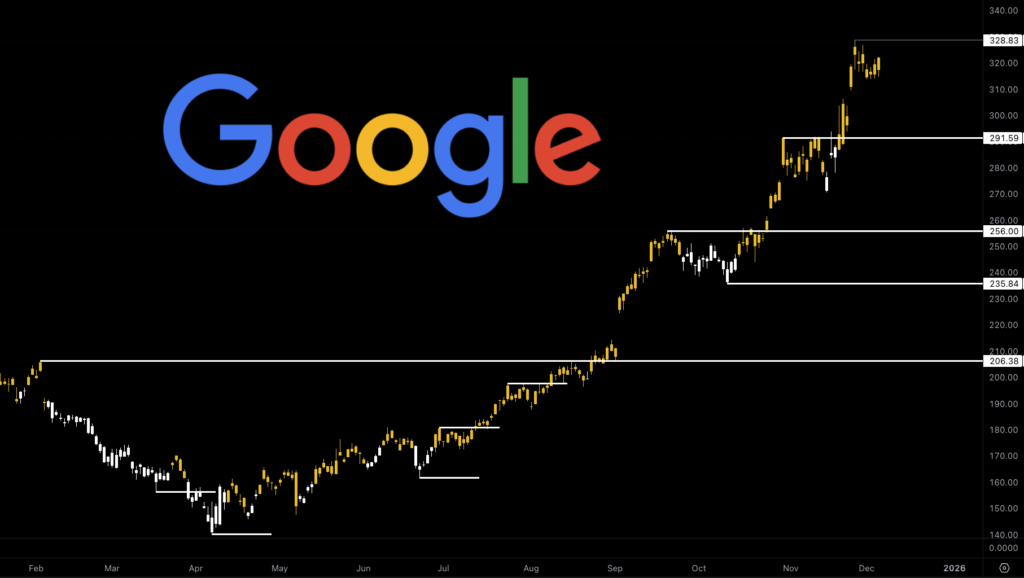
Support & Resistance
The Support & Resistance Indicator automatically plots points of support & resistance, perfect for new investors! The indicator extends the 4 closes support & resistance levels to the current price, and adds price labels on the Y axis.
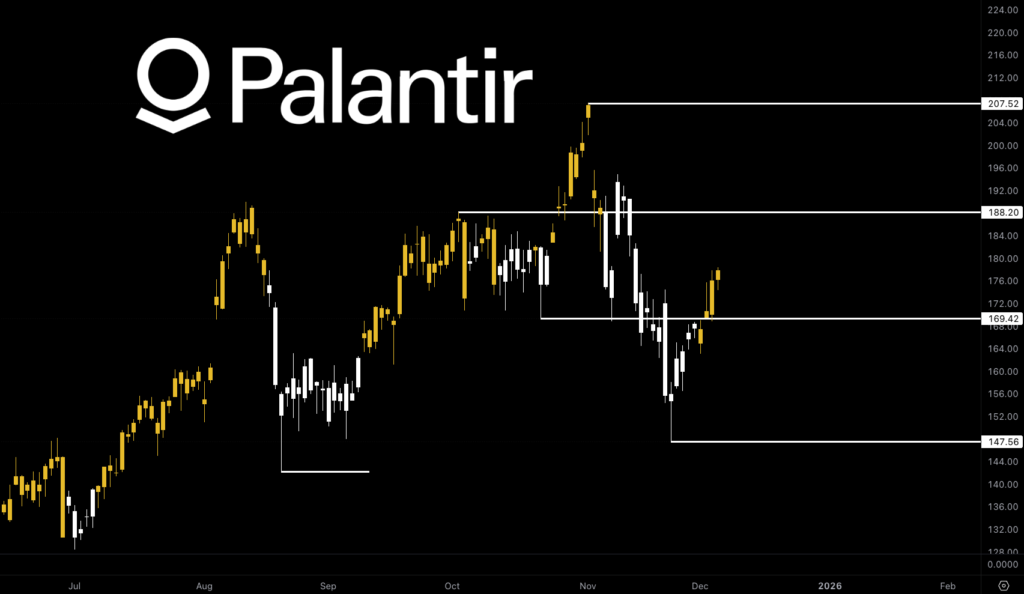
Support & Resistance
The Support & Resistance Indicator automatically plots points of support & resistance, perfect for new investors! The indicator extends the 4 closes support & resistance levels to the current price, and adds price labels on the Y axis.
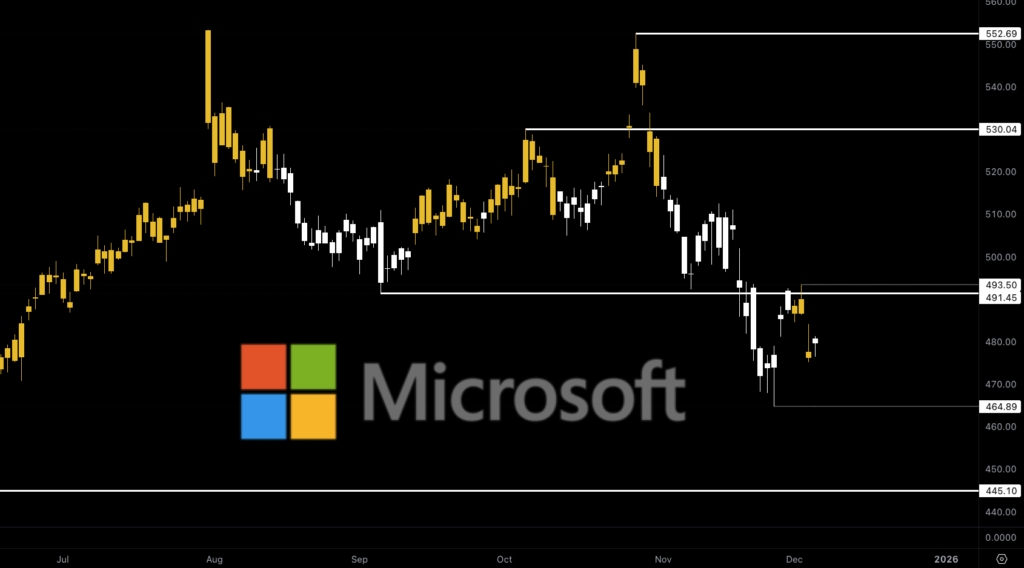
Support & Resistance
The Support & Resistance Indicator automatically plots points of support & resistance, perfect for new investors! The indicator extends the 4 closes support & resistance levels to the current price, and adds price labels on the Y axis.
MMTG Wave
Imagine the price of a stock like a 'hill'. Often the price of a stock rises (as if you're climbing a hill), and then falls (as if you're descending the hill). The MMTG Wave indicator helps visualise that hills, and tells you whether you're on the 'up slope' of the hill, or the 'down slope'. The MMTG Wave Indicator provides additional confidence to the MMTG Buy/Sell Indicator. Often generating a 'Buy' signal on the Wave before the chart itself, it can help you get into a position earlier, and out of a position earlier. Effectively a more sensitive indicator.